Quantcast
Channel: SoftArtisans
Viewing all 140 articles
Browse latest View live

Windows 8.1 Hyper-V in Review

$
0
0

Credit: TechRadar.com

[Reposted from www.nicolascouraud.com]

Working with developers, I have a love of client-side virtual environments. They allow for snapshots, easy portability of the development environment, and simple and unobtrusive replacement if and when someone blows up their development workstation. When Microsoft announced they were adding client-side Hyper-V in Windows 8, I had high hopes. However, the Windows 8 RTM release of client-side Hyper-V left a lot to be desired from a client-facing solution. It was merely a port of the server-side experience to the client. While it works well for me (I tend to run everything over RDP anyways), for our developers, lack of basic functionality like copy-paste or dynamic window sizing made it DOA.

Thankfully, in the Windows 8.1 (Blue) release, many of these shortcomings have been rectified! The virtual machine connection windows have been redone using the remote desktop engine which means that all of the features you didn’t have before (sound, 3D graphics acceleration, copy-paste), are now available without any workarounds. The full list of features supported in this enhanced session mode are:

  • Display configuration
  • Audio
  • Printers
  • Clipboard
  • Smart cards
  • Drives
  • USB devices
  • Supported plug and play devices

While this only works with Windows 8.1 guest OS’s, it does provide a viable path for ditching third party virtualization engines, and going full native, possibly saving you thousands in VMWare Workstation licensing costs.

Reference: What’s New in Hyper-V in Windows Server 2012 R2 


How to Render an SSRS Report Asynchronously using the Async\Await Keywords in C# 5.0 with .NET 4.5

$
0
0

The .NET Framework 4.5 introduced a simplified approach to the task-based asynchronous programming model (which was introduced as part of the Task Parallel Library API in .NET 4.0) via the utilization of the two new keywords:  “async” and “await” in C# (Async and Await in VB.NET). For detailed information, see Asynchronous Programming with Async and Await (C# and Visual Basic)  on MSDN.

In this post, I’d like to show you how we could use these new keywords when making asynchronous calls to the SQL Server Reporting Services web service.  For the purpose of simplicity, I created a very simple Windows Forms project in Visual Studio 2012 in which I just have one button which invokes the SSRS web service in the click event handler.

First we need to make sure the target framework for the project is set to .NET 4.5 in Visual Studio 2012 (from the project properties).

Then we add a service reference to the SSRS web service. This part is a little tricky.  In the “Add Service Reference” dialog, after we put in the URL of the ReportExecution2005.asmx file of the Reporting Services into the Address box and locate the service, in the “Services” panel it should list the “ReportExecutionService” and if you expand that, it would show the “ReportExecutionServiceSoap” underneath. Here we select the Soap service. Then, after specifying a namespace for our reference (I just named it as “SSRSWebService”), we click on the “Advanced” button at the bottom which opens the “Service Reference Settings” dialog (as seen in the screenshots). In this latter dialog, we will make sure the “Allow generation of asynchronous operations” is checked and the “Generate task-based operations” option is selected. What this does is that Visual Studio will generate the async methods for the SOAP proxy class by using the Task<> return types.  Then we click “OK” and close the dialog.

HowtorenderSSRSreport_image1 HowtorenderSSRSreport_image2

Here I would like to underline one key part. In the second step we added the reference to the SSRS web service as a “service reference” (just like a WCF service), not as the legacy web reference (which was the old way of adding web service references prior to .NET 3.5 and WCF).  One other thing I want to point out is that here I am using the ReportExecutionServiceSoapClient proxy class, not the ReportExecutionService class which would have been the case had I added the ASMX reference as a legacy web reference. The interfaces exposed by SSRS differ slightly (different method signatures and different members) between when it is added as a WCF service (in this case it is the SoapClient) versus a legacy web reference.  Since my goal is to use the new .NET 4.5 features, I had to create the service reference in the new WCF way.

In my WinForms project I render the report located at the /MyReports/Report1 directory in SSRS as a PDF file. Here is the code for the button’s click event handler:

// Here we have to define the method as "async" (hence the "async" keyword)
private async Task RenderReportAsync(string reportPath)
{
	// Instantiate the Soap client
	ReportExecutionServiceSoapClient rsExec = new ReportExecutionServiceSoapClient();
	// Create a network credential object with the appropriate username and password used 
	// to access the SSRS web service
	NetworkCredential clientCredentials = new NetworkCredential("MyUserName", "MyPassword");

	// Here, for testing purposes, I use impersonation for a local account on the SSRS server  
	rsExec.ClientCredentials.Windows.AllowedImpersonationLevel = System.Security.Principal.TokenImpersonationLevel.Impersonation;
	rsExec.ClientCredentials.Windows.ClientCredential = clientCredentials;

	string historyID = null;
	
	TrustedUserHeader trustedUserHeader = new TrustedUserHeader();
	ExecutionHeader execHeader = new ExecutionHeader();

	// Here we call the async LoadReport() method using the "await" keyword, which means any code below this method
	// will not execute until the result from the LoadReportAsync task is returned
	LoadReportResponse taskLoadReport = await rsExec.LoadReportAsync(trustedUserHeader, reportPath, historyID);
	// By the time the LoadReportAsync task is returned successfully, its "executionInfo" property
	// would have already been populated. Now the remaining code in this main thread will resume executing
	if (taskLoadReport.executionInfo != null)
	{
		execHeader.ExecutionID = taskLoadReport.executionInfo.ExecutionID;
	}

	string deviceInfo = null;
	string format = "PDF";

	// Now, similar to the above task, we will call the RenderAsync() method and await its result
	RenderRequest renderReq = new RenderRequest(execHeader, trustedUserHeader, format, deviceInfo);
	RenderResponse taskRender = await rsExec.RenderAsync(renderReq);
	// When the result is returned and if it is successfull, the rendered report's byte[] should be available
	if (taskRender.Result != null)
	{
		// Here for testing purposes I just writhe returned byte[] into a file on the server
		using (FileStream stream = File.OpenWrite("SSRS_Report_Async.pdf"))
		{
			stream.Write(taskRender.Result, 0, taskRender.Result.Length);
		}
	}
}

// In the event handler of the button click, again we have to mark it as "async" since
// we will be calling another async method and "await" its results
// - Note: The “await” operator can only be used within an async method
// otherwise the compiler will complain about it
private async void button1_Click(object sender, EventArgs e)
{
	button1.Enabled = false;

	await RenderReportAsync(textBox2.Text.Trim());

	textBox1.Visible = true;
	textBox1.Text = string.Format("Report Saved (ASYNC)");
}

To contrast this to the synchronous way of calling the SSRS web service, here is the synchronous version of the RenderReport method:

private static void RenderReport(string reportPath)
{
	ReportExecutionServiceSoapClient rsExec = new ReportExecutionServiceSoapClient();
	NetworkCredential clientCredentials = new NetworkCredential("MyUserName", "MyPassword");

	rsExec.ClientCredentials.Windows.AllowedImpersonationLevel = System.Security.Principal.TokenImpersonationLevel.Impersonation;
	rsExec.ClientCredentials.Windows.ClientCredential = clientCredentials;

	string historyID = null;
	
	ExecutionInfo execInfo = new ExecutionInfo();
	TrustedUserHeader trusteduserHeader = new TrustedUserHeader();
	ExecutionHeader execHeader = new ExecutionHeader();
	ServerInfoHeader serviceInfo = new ServerInfoHeader();

	rsExec.LoadReport(trusteduserHeader, reportPath, historyID, out serviceInfo, out execInfo);
	execHeader.ExecutionID = execInfo.ExecutionID;

	string deviceInfo = null;
	string extension = null;
	string encoding = null;
	string mimeType = null;
	Warning[] warnings = null;
	string[] streamIDs = null;
	string format = "PDF";
	Byte[] result;

	rsExec.Render(execHeader, null, format, deviceInfo, out result, out extension, out mimeType, out encoding, out warnings, out streamIDs);
	
	using (FileStream stream = File.OpenWrite("SSRS_Report_Sync.pdf"))
	{
		stream.Write(result, 0, result.Length);
	}
}

private void button2_Click(object sender, EventArgs e)
{
	button2.Enabled = false;
	RenderReport(textBox2.Text.Trim());

	textBox3.Visible = true;
	textBox3.Text = string.Format("Report Saved (SYNC)");
}

When we run this application, one important difference that we notice is that the synchronous version blocks the whole UI for the user until the report rendering is complete. On the other hand, when using the asynchronous version, the UI remains responsive.

Hope this was helpful!

Quantify Me: The Rise of Self-Tracking

$
0
0

Credit: Syncstrength.com

“Have you heard of the quantified self?” my coworker asked me.  After a puzzled stare and a furrowed brow I assured her I hadn’t. So of course I immediately clicked over to a new tab and typed “quantified self” in the browser. Turns out I had heard of this concept, I’d just never put a name to it. In fact, I’d been partaking in this movement for years – tracking my whereabouts with Foursquare, logging my calorie intake with MyFitnessPal and recording my workouts with RunKeeper. I even had a stint with Saga, the app that tracked your every single move without you having to do anything! Just install the app and let ‘er rip.

There are a ton of apps and wearable devices dedicated solely to this purpose of tracking and quantifying oneself, all with the ideal goal of finding correlations and being able to improve upon your productivity, fitness, and overall well-being. The Zeo monitor straps to your head, monitors your sleep cycles, and comes equipped with a programmable alarm clock that wakes you at the optimal phase of sleep. Adidas has a chip called miCoach you place in your shoe and it will record your speed, subsequently breaking down your recorded data graphically on their website. Samsung hopped on this trend and partnered with Foursquare to visually capture your whereabouts with their Foursquare Time Machine. Of course curiosity got the better of me and I gladly gave them access to my Foursquare check-ins. Take all of my data, Samsung! Link all of my accounts? Suuure. The more the merrier. Just remember to spit back a cool interactive image so I can see all of my data.

I’m not alone in my curiosity. It was reported last year that wearable monitoring devices raked in an estimated $800 million in sales. And it doesn’t stop there. IMS Research projects that the wearable technology market will exceed $6 billion by 2016. People are buying into this self-tracking movement. So why the obsession?

It’s no secret people are fascinated by themselves. The sweetest sound to any person is the sound of their name. We enjoy documenting our lives. (Enter the sudden rise of selfies.) We’re fascinated by ourselves. Most people within the quantified self sector argue, however, that the main goal behind keeping a record of our activities and behaviors is to improve our quality of life. Tracking oursleves allows us to find interesting correlations we may not have seen otherwise, or rather gives us the big picture of our activities and behaviors. Another possible explanation could lie in Leon Festlinger’s social comparison theory, which is the idea that individuals are driven to gain accurate self-evaluations. They look at those around them to quantify the uncertainty of life and provide some type of framework to objectively measure their self-worth. Are we fascinated with quantifying ourselves to see if we measure up to those around us? The social sharing features within these devices definitely play into this idea.

And this may be a positive thing. Senior research psychologist at the American Institute for Behavioral Research and Technology, Dr. Robert Epstein, says, “Research shows clearly that heightening awareness of one’s performance virtually always improves that performance – smarter eating, higher productivity, superior performance in sports, and so on” (reference). In other words, tracking your every move leads to greater self-discovery and self-betterment. From personal experience, I know I tend to get lost in the everyday details and these apps let me look back at the big picture, putting all of the small puzzle pieces together and providing a larger, newer perspective on my daily activities.

On the flip side, is constantly quantifying yourself all it’s cracked up to be? Is this measured life in fact making us happier and healthier or more obsessed and hyper aware of measuring up to those around us? I don’t have the answer, but I tend to pitch my tent in the former camp, particularly when it comes to the health sector. The emergence of self-tracking devices has led to new discoveries in curing diseases and ways to improve our mood, diet, sleep, and productivity. Whatever the underlying factors for this wave of putting your life into numbers, devices and apps dedicated to doing just that aren’t going anywhere. They’re gaining ground and changing the way we interact and make decisions.

Author’s note: MIT’s Emily Singer, biomedicine editor for The Technology Review, has an entire magazine section dedicated to this concept. If you haven’t already, you should check it out and add it to your Feedly reader.  The Measured Life is a section of MIT’s The Technology Review that covers the self-tracking movement looking at the tools and people who use them. Another great resource is QuantifiedSelf.com where they host weekly discussions and meetups surrounding this topic of the quantified self.

Truth in Tech Ep 23: The Quantified Self – Everything in Measuration

$
0
0
This week on Truth in Tech we roped in Mark Moschel and Eugene Granovsky, co-organizers of the Chicago Quantified Self Meetup group and owners of AskMeEvery. As featured in Mashable, LifeHacker and The Next Web, AskMeEvery is a way to track your activities and behaviors over time through daily questions, making you more mindful of the ways in which you spend your time. Listen as Mark and Eugene give us the scoop on translating your life into numbers. Where did it come from? What apps/devices are at the forefront? What are the types of people who track? Should we really be measuring everything?

truthintech23

The Intern Diaries: Madalyn

$
0
0

This is the third installment of our Intern Diaries series, wherein each week our lovely interns give you the inside scoop on what being a programming intern at a high-tech startup is really like. Read the first and second post of the series or listen to this group’s first podcast.

Madalyn

Hello! My name is Madalyn Coryea and I am in intern this summer at Riparian Data in Watertown, MA. I am heading into my senior year at Worcester Polytechnic Institute as a Computer Science major & Digital Art minor, and this is my second technical internship.

One of the best parts about having a computer science internship is that you get to experience working at a real company on a real team of software developers. At both of my internships I’ve been able to work at companies where I write real code that directly influences the product. This is something I especially look for when I apply for an internship. If you’re like me, and want to be a key player in “the big picture” at your company, make sure you get to know what you’ll be doing at your interviews. If you don’t ask, you won’t know what the company expects from its interns.

Key phrases to look out for are: “We have a summer project that we put the interns on,” or “We have an exciting program planned for you!” Usually this means that the company doesn’t have interns working with their real product. Sometimes these companies are just trying to establish relations with interns to make them full-time employees when they’re done with college. Other times, they are just trying to fill an “intern-quota” to make the company look better. Personally, I would feel like this is wasted time. I want to be treated like a developer, and I want to be a contributor to the software. To avoid getting stuck with a gimmicky internship, I usually want to hear, “We need developers to work on our product.” It’s worked out for me so far! And a great part about being a Computer Science intern is that we are in high demand. This is good news for us! It means we can have our selection of companies to work for. So there’s no reason to go to a boring company at an internship you think you’ll hate.

Once you have your internship, you will really learn if this is what you want to do. Is this the type of code you want to write? Is this the kind of software you want to develop? Do you like front-end or back-end or something else? With the Computer Science industry as huge as it is, there are so many areas where you can find yourself happy with your work. And since internships are a short-term commitment it’s okay to experiment with different types of jobs in software.

So how do you get this wonderful internship?

Step 1: Apply early

You can start looking for an internship as soon as the summer is over, but you should plan on making a decision by or before the spring (the end of spring break is when the majority of companies have already picked their first round of intern candidates). This doesn’t mean companies aren’t still looking for interns come summer-time (they are); but to get your first pick as well, look early.

Step 2: Keep your resume awesome

You’re a Computer Science major (or something tech-related)—you’re already awesome! So make sure your resume shows that. Let companies know you have the skills they want and need. And make sure they know if you don’t have those skills yet, you can learn them on the job (something a lot of people worry they can’t do, but end up surprising themselves—myself included!). It’s a good idea to beef up your resume with past experience and examples of projects you’ve done at school. If you can show that you’ve worked on a team before, companies will see that as a huge plus.

Step 3: Get the interview

Go to career fairs (where I’ve snagged both my internships). It’s like speed-dating for companies. You meet a lot of people, hand out a ton of resumes, and learn a bunch about the different places where you could work. Tell employers what kind of internship you’re looking for, your major, your skill set, and what you’re passionate about. And don’t forget to ask questions about them too! A good standby is, “What do you like about working at your company?” Make sure to follow up with emails and online applications. Reach out—it’s the only way to get something back. And if you really hit it off at the face-to-face career fair meeting, chances are that’s all you’ll need for a call-back to an interview.

Stay tuned for part 2 in this 2-part series, where Madalyn reveals the last 4 steps and what to do after you’ve sealed that interview.

When to use SUMIF vs. Pivot Tables in Excel

$
0
0

SUMIF and PivotTables can both summarize data based on specific criteria, but they do so in completely different ways. In most cases, PivotTables are going to be faster and easier to get the data that you want, but sometimes using Excel formulas is the only way to handle complicated data.

All the examples from this blog post can be found in this workbook: SUMIF_PivotTable

WHY PIVOT TABLES ARE BETTER

Let’s take a look at a quick example of some fruit sales data, where we want to find information like: all sales for a date, total sales for a fruit in the given time period, or total sales for a type of fruit on a given day.

ExampleData

With SUMIF, you can specify the range of values you are using as the criteria (dates or fruit), the values you want to sum (sales), and the actual criteria that will determine if the values are included in the sum (“7/2/2013″, “Apple”). SUMIFS (new in Excel 2007) extends this functionality to allow multiple criteria (dates and fruit):

ExampleFormulas

Note: Excel also offers COUNTIF, COUNTIFS, AVERAGEIF and AVERAGEIFS starting in Excel 2007.

You can do the same with PivotTables, but the PivotTable will also handle sorting, grouping and organizing your data so you can just lift the aggregated values right out from the table:

ExamplePivotTable

Here the values are automatically generated by the PivotTable. No extra work needed aside from creating the PivotTable, which is as easy as selecting the data range and specifying where the table needs to go.

Excel also applies PivotTable styles, which change be switched in one click and you can even create your own custom styles.

WHY WOULDN’T YOU USE PIVOT TABLES?

I extended my fruit example to use sample data from the AdventureWorks database, where I wanted to compare online and retail sales for North America, broken down by quarter:

AWSalesData

It didn’t take me too long to set up a dashboard that displayed the data that I wanted with a PivotTable and I tossed in a PivotChart as well:

SingleRegionPivot

While it was fast for me to create this mini dashboard, I could have run into some problems if I needed to create an elaborate layout:

  • PivotTables can be finicky if you need a complex layout or your desired formatting deviates from the defaults that Excel provides. Depending on the layout of the table, you may find that creating the table and formatting from scratch will save you time.
  • PivotCharts are rigidly tied to the PivotTable. Whatever is displayed in the PivotTable dictates what is displayed in the chart. If the chart is your top priority, you may want to use regular formulas/data to guarantee that your chart looks the way you want it.

Of course, there is also the overhead of learning how to use PivotTables: it can take time to become accustomed to using them. In which case, it may be more efficient to stick with what you know, especially if you are under a time crunch.

For example, in a similar amount of time (<5 minutes), I was able to create an identical mini-dashboard using my own formatting and SUMIFS formulas:

SingleRegionFormula

THE BIG REASON TO USE SUMIF OVER PIVOTTABLES

Next I tried creating a dashboard with sales data from three regions, each on a separate worksheet (North America, Europe, Pacific). This proved so difficult with PivotTables that I actually ran out of the time I allotted for writing this blog post and had to move on.

Excel PivotTables are designed to handle a single area as a data source. There is a way to use multiple areas in a PivotTable (multiple consolidation PivotTables), but you need the PivotTable wizard to create them. (If you need help finding where Excel has hidden the PivotTable wizard starting in Excel 2007, check out Debra Dalgleish’s tutorial on how to  add the PivotTable wizard to your ribbon).

My first attempt was to use the data sources as is and then a twisted creation popped out of the wizard:

PTMultiSourceTry1

Then I tried manipulating the data to only include the quarter, online/retail flag, and the sales data, but the result wasn’t acceptable:

PTMultiSourceTry2

At this point I had to give up because I was out of time. Then I switched to using SUMIFS and I was able to whip up the dashboard I wanted (with formatting, charts, and sparklines) very quickly:

MultiRegionDashboard

IN CONCLUSION

PivotTables are generally faster because they are automatic. Some of the price you pay for being automatic is that layouts and charts aren’t easily customized. Also, if you’ve never worked with PivotTables before, they can be daunting. Using multiple areas as a data source is almost impossible, even if a wizard is available (but hidden).

Formulas are easy to use, so it may save time if you’re comfortable with them, but you will need to create everything from scratch including the formatting. Formulas may also be the only realistic option for complicated data sets, especially if the data is on separate worksheets.

ScoreCard

The Intern Diaries: Madalyn [Part 2]

$
0
0

This is the fourth installment of our Intern Diaries series, wherein each week our lovely interns give you the inside scoop on what being a programming intern at a high-tech startup is really like. Read the first and second post of the series or listen to this group’s first podcast.

Need to catch up? Read the first part of Madalyn’s 7 step guide to getting a tech internship here.

perfman_hr_job_interview STEP 4: TIME TO IMPRESS

You get that wonderful email, that inspiring phone call: Would you like to come in for an interview? Hooray! Then the nerves hit. Oh no, interview! This is all that’s between you and that internship now. Just remember, don’t freak out. You’ve already risen to the top of everyone at the career fair. Your resume was put on the top of that giant resume pile. The company already strongly believes they want YOU. Why do they think that? Your people skills impressed them at the career fair; they were awed by your dazzling resume; and they have reason to believe (based on your school projects and past experiences) that you’ve got what it takes to work on a team and write good, quality code. But they don’t want a code monkey. They want an engineer. Someone who is thoughtful, and thinks deeply about the code they design.

So you got the interview. The company has thrown the first pitch and you’re up to bat. Unfortunately, as it has been true for me in the past, whenever I feel I’ve bombed the interview I’ve been offered the job, and whenever I think I’ve nailed it I’ve been rejected. So there is no sure-fire way to tell if you’ve done Step 4 correctly when you walk out of that interview room. (Aside from them offering you the job right then and there—which almost never happens).

So you’ll probably be nervous. And guess what? So will the company. They’ll be nervous for the awkwardness that is meeting new people and not knowing what to expect. Your interviewer(s) will be worried about you not being a good fit and having to interview yet ANOTHER candidate. So instead of reading hundreds of tech interview books (which can help with brushing up on those technical questions), here’s what you do:

Keep in mind that your interviewers don’t care all that much if you get the (technical) answer to every question right. They want to find someone who has good team and collaboration skills. They want to hire someone who can think through problems and who doesn’t give up. This is what you have to show them. Think out-loud; talk through problems. Show them your strategies. Draw diagrams on the whiteboard if it helps you (as a visual person, I’m always doing this, both in and outside of interviews). What you’re doing is letting them know you are not just some “computer science student.” You are a problem-solver. And that’s what really matters.

 STEP 5: FOLLOW UP

You’re done with the interview, and now the stress is over. Make sure you email your interviewers and thank them all for their time. It’s most likely that your interview took a big chunk out of their day, interrupting their coding projects and daily schedule. So you should thank them for that. They went out of their ways to give you a chance to have an interview. So showing your appreciation can go a long way.

 STEP 6: WHAT’S NEXT?

Within the next few days to the next couple of weeks or so (sometimes up to a month, but that’s rare) you’ll get the news. Did you get the internship or not? If you did, hooray! But don’t jump ship just yet. And if you didn’t, you now have more interview experience and are even more prepared for the next interview. So now what do you do? This is true no matter what the company just told you: KEEP APPLYING FOR INTERNSHIPS. Just because you got an offer doesn’t mean you have to work there. As a computer scientist, you have options! And you should pick whichever internship will make you the happiest. (Just like how I selected Riparian Data out of several companies I had offers from). And hey, maybe that first company is the one you’ll end up wanting to work for. But you owe it to yourself to see what’s out there. Don’t forget you’re in-demand; so you have the flexibility to shop around for internships, even if many others don’t. And you’ll get even more interview experience!

STEP 7: THE WORK BEGINS

Sign some forms, find your desk, and you’re ready to begin. It’s day one, and you might be wondering if you’ll be able to do anything that the company wants you to do. At my first internship, this is where I panicked. I figured I had never worked at a real company before, and had assumed that I’d gotten myself in way over my head. I would get asked to do something and had no idea where to start.

After the first two weeks, I had one of the biggest revelations I’ve ever had in my life. And this is something that I didn’t pick up in any class at school, or in any other situation where I’d felt stuck. At my internship last summer I learned the most important thing a computer scientist ever needs to know: You can teach yourself how to do things. How? With Google search. Google is a programmer’s BFF. Trust me, when this clicks it is the most amazing thing. This is how other developers find solutions to problems without any past experience. This is how companies figure out step-by-step what tools they’ll need. Think about it: no one can know everything they need to without starting from somewhere. And from that somewhere you’ll “step-by-step” work towards a goal. If something seems overwhelming, break it down. What are the pieces that need to mesh in order for this to happen? Problem-solve.

If you’re really stuck, ask questions and ask someone to help you, but chances are, you have more skill than you realize, and that’s why you were hired in the first place. Just remember (or realize, like I did) that the internet is such an awesome tool, especially for us developers. You can learn pretty much anything about any subject. This makes me think of the pro-internet AT&T commercial a few years back about the endless store of knowledge the internet can bring us. (It’s also pretty funny!)

Embedly Powered

Embedly Powered

Embedly Powered

Just like the kids in the video, use the internet as a learning tool. It feels awesome when you gain the power to be able to do things you didn’t think you could. A whole lot of confidence comes with being able to figure things out, to just dive in and DO stuff. Confidence is the one thing that will get you through steps 1 through 7. In computer science, confidence helps you from career fairs to interviews to the job itself. With that confidence (and quite a bit of help from Google) you can tackle any class, project, internship, or career. So good luck! I hope you get the internship you’re looking for full of awesome coding, cool people, and a fun summer the same way I did.

About

MadalynHello! My name is Madalyn Coryea and I am in intern this summer at Riparian Data in Watertown, MA. I am heading into my senior year at Worcester Polytechnic Institute as a Computer Science major & Digital Art minor, and this is my second technical internship.

Carpe Datum: How to Export Your GMail to Excel

$
0
0

Credit: Hongkiat.com

[Crossposted from Riparian Data]

Straightforward title, straightforward goal, ugly and roundabout (but free!) method of achieving it.

For some time now, I’ve had this goal: download my gmail data, analyze it, and visualize it.

The last time I tried this, I glossed over the whole getting your gmail data into Excel part. This is because I wasn’t able to do all of it myself–Jim had to take my ugly mbox data and make it Excel-readable.

But now, thanks to the basic python skills acquired in my data science class, I can do everything myself! Kinda. The code in part 3 will probably make a real programmer scream, but for the most part, it works–though it’s not fond of commas in subject lines. And if you, like me, are not a programmer–don’t worry! You can still run the code, using my trusty copy/paste/pray methodology.

Alors, here goes:

Step 1: From Gmail to Apple Mail

You have Apple mail, right?  You can also do this with Outlook, and probably other desktop clients.

1) In your Gmail settings, go to the “Forwarding and POP/IMAP tab” and make sure POP is enabled.

2) Now, add your Gmail account to your desktop client o’choice. If it’s already there, add it again–you’re going to be removing this one.

Important: Do not check the “remove copy from server after retrieving a message” box!

Step 2: From Apple Mail to mbox

This part is easy. Just select your mailbox in the desktop client, and go to Mailbox->Export Mailbox, and choose a destination folder.

Step 3: From mbox to csv

If you try to save your pristine mbox file as a csv, you will get a one column csv. Don’t do that. Instead, use these python scripts (also up on github).

The first script opens a blank csv file, and fills it with the subject, from, and date lines for each message in your mbox. I called it mbox_parser.py.

import mailbox import csv
writer = csv.writer(open("clean_mail.csv", "wb")) for message in mailbox.mbox('your_mbox_name'):     writer.writerow([message['subject'], message['from'], message['date']])

If you don’t know what python is, you can still run this script. Here’s how:

1) copy the above code to a plain text file, and save it as mbox_parser.py. Save it to the same folder you saved your mbox file to.

2) open your terminal (spotlight–>terminal)

3) type cd Users/your_account_name/directory_where_you_saved_your_mbox,

4) type  python mbox_parser.py

5) Voila! In your directory, you should see a new file, cleaner.csv.

You’ll notice that the ‘date’ column is a long, jam-packed date string. It’ll be much easier to extract insight if I split this puppy up so that the day of the week is separated from the calendar date. Unfortunately, this is not totally a walk in the park. More like a walk on the wild side, heheh.

6) Save the following script as split_date.py and run python split_date.py clean_mail.csv dated_mail.csv in your terminal:

#!/usr/bin/env python import sys import csv
infile = open(sys.argv[1]) outfile = open(sys.argv[2], 'w') writer = csv.writer(outfile)
for line in infile:  splits = line.split(",")  newline = []  if len(splits) == 4:    for i in range(0,3):      newline.append(splits[i])  else:          newline.append("None")  print newline  writer.writerow(newline)
 infile.close() outfile.close()

7) Lastly, let’s add a header row to your csv:

file_read = csv.DictReader(open('dated_mail.csv', 'rb'), ['subject', 'from', 'day', 'date']) file_write = csv.DictWriter(open('final_mail.csv', 'wb'), ['subject', 'from', 'day','date']) file_write.writeheader() file_write.writerows(file_read)

Coming up in part 2: Basic analysis and visualizations!

Like what you’re reading?


// ]]>


Truth in Tech Ep. 24: Generation Cord Cutter

$
0
0

Today, wifi and a streaming box will give you everything your cable subscription does (yes, sports included), for around $30-40/month. We go over your options, including AppleTV, Xbox, and Chromecast, Google’s new ultra-budget-friendly thumb drive.truthintech24


Truth in Tech Ep 25: StackOverflow and the Next Wave of Social Media Networks

$
0
0

truthintech25

When Jeff Atwood and Joel Spolsky launched StackOverflow  in 2008, the site quickly became the place for programmers to ask and answer questions. Today, one site has become 105, and cryptographers, grammarians, and homebrewers have joined the original core group of programmers. StackOverflow users Nick Martin and Seth Moore guest star as we discuss what might just be the model for the next wave of social networks.


Want to guest star? Have an interesting tech topic, startup, or story of the week? Email us! elisek@softartisans.com Or find us roaming the Twittosphere @elisekovi and @clairedwillett.

Staff Picks: What are you reading?

$
0
0

Once a week I snoop around the office, bothering my coworkers with questions on what they’re reading, listening to, consuming, or any other random inquiries of which I’d like to subject them. Sometimes they even respond.

The question:
1. What did you read this weekend/this morning?
 
The answers:

Dan, CEO of SoftArtisans

1. List of ingredients on my Entenmann’s raspberry danish twist.

David, CEO of Riparian Data

1. “Who’s in Charge?” by Michael Gazzaniga

Gazzaniga is a neuroscientist explaining how we make decisions

2. A ton of articles on encryption: Elliptic Curves, Learning with Errors, BitMessage

Aviva, VP of Technical Services

1. Lean In: Women, Work and the Will to Lead by Sheryl Sandberg

Nick, IT Admin

1. I’ve been reading about Salt, a new type of configuration management tool.

Claire, Marketing and Business Development
1. I read The Making of 158 Marimba by Jacklin Studios
Kelly Jacklin created what became the iPhone’s default text message alert sound in 1999, using LISP, Perl, and MIDI.
 

Seth, Developer

  1. I read an article by NewScientist about Kindergartens who can program before they can read.

Alex, Programming Intern

  1. Eloquent JavaScript and the Lean Startup

Jim, IT Admin

  1. Daemon by Daniel Suarez

Elise, Content Manager

1. HubSpot’s Blog – “How to Identify Content Topics that Hit Home with Your Readers

*Any articles you found interesting or questions you’d like to see in this blog series? Let us know in the comments section.

New Webinar! Make Reports that Measure Up

$
0
0

Take a look at how OfficeWriter can turn your drab Excel reports into chart-topping spreadsheets. This month, it’s all about music as we cover your favorite bands, artists, and labels.

In this webinar we’ll cover:

  • Grouping and nesting in Excel
  • Using SQL Server Reporting Services (SSRS)
  • Charting in Excel and relationships between genre, artists, labels, and album price

When: Friday, August 23, 2013 at 1 P.M. EST

*Register early as space is limited.

Can’t attend? Register anyway, and we’ll send a copy of the slides and recording following the webinar.

// ]]>

Intern Diaries: Summer Send-Off

$
0
0

IMG_1841

A BIG thank-you to our summer interns for all of your contributions you’ve made to our products and team these past few months. You will be missed. Best of luck in your classes!

Reflections and Advice:

Shane: 1. The team is more important than the product. I’d rather be on an amazing, supportive team working on a boring project than work on an amazing project with an unappreciative team that doesn’t trust me. While I wasn’t sure what I was going to be working on this summer, I knew I was choosing a supportive team, and that has really differentiated my internship from a lot of my friends’ internships.  2. a. Look early. There is nothing wrong with starting the search in September. Most companies already have their listings up and you’ll look pretty on top of things when you’re applying in the Fall. In fact, when you get your internship in October or November, you don’t have to worry for the rest of the year, while your friends start stressing in February and March.

b. Figure out what you’re looking for. I like to think of internships like how I think of classes. You don’t sign up for any classes within your major. You pull out the registration book and think about what you’re interested in or what you need to learn more about. Similarly, don’t send an application to every tech company you’ve ever heard of. If you want to get comfortable with MongoDB or get real world experience with Objective C, find the internship that will let you do that. If you just send out scatter-shot applications, you’re going to end up writing assembly language.

Madalyn: I had a fantastic summer, and I’m really sad to be leaving Skimbox. When I started, the company was called Riparian Data and the email app that we were making was called Gander. Through a long process, where my input was included, the company name and the brand name became Skimbox. That change was really cool to see and be a part of. I loved working for a startup, and I think that’s a great place for any intern to work. You get to see the entire evolution of a company, and you are an active member in that process. You won’t get that experience at a big corporation. Wherever you go after your internship, and whatever you do, you will have the knowledge (to some degree) of what it takes to run a company. It is something everyone should experience at some point. You get to see the passion of the people involved in startups, who are trying to take their ideas and turn them into a product and a company.

Alex: As the summer fades away and I approach my return to school, I can’t help but to notice a grin spreading across my face. In high school, I dreaded the final days of summer. It signaled the end of trips to the Berkshires, spontaneous adventures, and marked the beginning of a downpour of homework.

Going back to college is different. While there is still work to do, most of it is for my Computer Science classes. My friends think I am weird and my parents have no idea what I am doing, but I genuinely love to program. When I leave next Friday, it is a real goodbye. It is a farewell to being a part of a team, working on important projects, and to my coworkers, who were always ready to impart their programming wisdom and knowledge.  It is always hard to leave my family, but while at school, I will long for my internship at SoftArtisans more than anything else. I can always call my parents when I miss them, but phoning into the office wouldn’t quite do the trick.

I am extremely thankful for my experiences here and can only hope for more experiences that allow me to grow as a programmer and as a person.

Monday Melodies

#Inbound13: Seek Out the Things That Might Not Work

$
0
0
#Inbound13
Be Remarkable
Seek Out the Things That Might Not WorkOne Republic

The sweeping theme of this year’s Inbound conference by HubSpot, a conference dedicated to marketing professionals, was “Be Remarkable.” A show-stopping lineup of speakers and classes covered how to better manage and be remarkable within your inbound marketing. Last year, I felt there was a heavy emphasis on goal-setting in relation to your marketing efforts, whereas this year the emphasis seemed to lie heavily on context – the idea of knowing where your buyers are in the marketing funnel and then creating personalized content accordingly. This ties back to HubSpot’s core emphasis on customer-centricity and keeping the customer and their needs at the center of all of your marketing efforts. Delight and surprise. Using that school of thought, you will create relationships with your audience/customers, who ideally will become advocates for your brand and product because you provided them with something of value.

The one downside of the conference was the long lines to attend the classes the first day. However, in true HubSpot fashion, they listened to the attendees gripes and opened up more conference space along with repeating some of the popular classes. HubSpot’s main focus is on education – educating and empowering the customer. With a ton of classes and three days worth of learning, it’s easy to get lost in the swamp of information, which is why I did the heavy lifting for you. To better manage the onslaught of information and help myself put it into context (See what I did there? Heavy sigh. I know, bear with me. No more cheesy references. I promise.), I like to look for patterns and group items into categories. These were the large umbrellas I found the talks and classes fell under, along with the big ideas to take with you from the conference.

Inbound13: Nate Silver

Overarching Themes of the Conference:

Context:

Content is a staple to your marketing, bar none. However, context is not to be overlooked. It is the framework upon which you build your content. Context allows you to take into consideration the buyer’s experience at every stage in the buyer’s decision model. Use context to be a resource. Just as HubSpot is a resource for marketers and marketing strategies, so too should you be for your customers. You need to keep your customer at the center of your marketing. “Engaging with context” is key to building those customer relationships. In other words, you need to take into account where that person is in the buying cycle, how they have interacted with your site, if they want to talk to you right now or if they are just researching. You need to take into account who they are, what their needs are, what content they’re interested in, what information they’re seeking, and how they want to be interacted with. You can’t treat every person the same, because everyone is different, with differing needs.

Customer-centricity:

This falls within the realm of providing context to your content marketing. Put your customers at the center of your marketing efforts. Solve for the Customer (SFTC) was a phrase which popped up over the course of the three-day conference. In other words solve for the customer versus solving for the transaction. In the algebraic sense, solving for “X” puts “X” at the focus of the equation. That is what you are basing all of your moves around, all of your content around. Instead of approaching the marketing/sales process as a transaction, as a means-to-an-end, approach it with the customer at the center.

Work/Life Balance:

We are multitaskers. We are constantly innovating. With so many news sources and fragmentation of media/products, we’re challenged to be on the forefront of these trends. With the abundance of information and ease of access, there is a fear you will miss out on the latest-and-greatest. Arianna Huffington, Editor in Chief of the Huffington Post, as well as several Bold Talk speakers addressed this FOMO (Fear of Missing Out, for all those out of their teenage years). Connection is at the core of what we do. However, Arianna Huffington said we are in a constant state of motion, running ourselves ragged in an attempt to keep up. Huffington along with several Bold Talk speakers emphasized the need to disconnect and reconnect with your wellbeing so that you can grow and use your leadership skills to your full potential. By first taking care of yourself, you are better able to lead and care for others.Inbound13: Arianna Huffington

Failure is Inevitable:

Failure is part of the process. Best selling author and renowned speaker, Seth Godin, addressed this in his keynote. He said, “If you’re not willing to fail, you’re not willing to succeed.” Leaders/CEOs need to foster an environment where failure is accepted as part of the road to success. Everything is built upon everything else, just like Jenga, as another conference speaker pointed out. You learn from your mistakes. Godin gave the example of a company that sunk $2 million into an unsuccessful marketing project. The CEO’s response? I just spent $2 million dollars learning what didn’t work. Now let’s learn from it and find what does. This way of thinking about a project was exactly something our CEO told me. Now, don’t get me wrong. This does not mean you just get free reign to blow $2 million on a project. It means you should learn from your mistakes and not be afraid to deviate from the norm and try something new because of fear of failure. I know I struggle with this concept. I am a planner. I come from the generation where you’re rewarded for doing things right. Arianna Huffington addressed this problem of the millenials. She said, “Sometimes things are complete without finishing them.” Know when to let things go, when to put a project down and tell yourself it is finished. Huffington said that certain times we need to readjust our way of thinking about something as complete. Sometimes putting it down means completing it. Just remember to take a new lesson away from your failure experiment.

Also in his speech, Seth Godin advocated to go where others are not, to fight the urge to follow the herd, to not simply ask for a task and complete it. He said in order to lead we need to be willing to take risks and not simply rely on passivity. This is not to say we have to constantly defy and question authority, but rather to take initiative in trying out new ideas and paths to problem-solve with risk of failure. He asked us to consider this question: “Are you coming back with a point of view?” Companies, CEOs, leaders, and teammates value those with a viewpoint, with an opinion.

Godin also argued that the normal curve is melting with the onset of niche groups forming, and connecting through the internet. He dubbed this as the fracturing of culture into “tribes,” allowing people of differing and similar viewpoints to find each other. The key here is that all of these communities and connections are forming and value is created where connection occurs. He asked us to consider if we are worth connecting to? Are we like Amanda Palmer who made a name for herself worth connecting to because she was authentic and unique and true to herself. Seth Godin said we have to earn people’s attention. People are busy and have their attention pulled in many directions. His point was similar to HubSpot’s CEO Dharmesh Shah’s talk in that consumers have both choice and voice. With the internet consumers have the ability to research all of their options, and with social media they have a say in how they want to be engaged in the buying process. Godin said we’ve shifted to a society where network and connection matter, where you must earn people’s permission to interact with them. In order to earn that permission, you have to be willing to try what others are not. You have to be willing to fail.

My favorite quote from his speech, though, was, “Seek out the things that might not work. The minute someone gives you a map, it’s not art anymore. It’s paint-by-numbers.”  He gave the example of a coffee shop that had a “Dis-loyalty Card.” This card was unlike the typical reward punch cards in that instead of getting you to buy “X” number of coffees at that coffee shop, the coffee shop had you try “X” number of his competitors’ coffees and then return to redeem for a free coffee. This coffee shop was not afraid to try something out of the ordinary. When others were providing the same frequent buyers rewards cards, this coffee shop was looking in a different direction and willing to challenge the status quo. Marketing is art. It’s a lot of trial and error, of discovery, of finding what works for your business and what doesn’t, of failure, and of seeking out the things that might not work.


Webinar: Data Visualization and NodeXL and Marc Smith

$
0
0

nodeXLgraphAnalyzing and presenting your data is a daunting task. OfficeWriter makes it easier. Next week, we’re making it easier still with a new webinar on data visualization. Joining us is special guest Marc Smith, creator of NodeXL.

Marc Smith is the Chief Social Scientist at Connected Action Consulting group. Prior to that he worked at Microsoft Research, where he created NodeXL, an Excel add-in, which allows you to import and visualize your social network data, anything from email to Twitter to Flickr and beyond.

In this webinar you will learn:

  • The origins of NodeXL and what it could mean for businesses in regards to social networks
  • How to find the connections and patterns within your social network communities
  • How to use NodeXL to graph the connections between trending Twitter conversations

Q&A with Marc Smith

Leave with new ideas on graphically representing your data, and see how social can impact your business.

When: September 11, 2013 at 1 P.M. EST/10 A.M. PST

*Register early as seating is limited. Can’t attend? Register anyway and we’ll send a copy of the slides and recording following the webinar. Just be sure to write “Request for slides” in the notes section, so we have an accurate head count. Thank you!


// ]]>

Fall Career Fairs: Have You Got What it Takes?

$
0
0

SoftArtisans TeamComing to a college near you.  We’re seeking inventive college students with object-oriented programming under their belts, a penchant for amassing new skills and those who don’t mind a few BBQs.  Think you’ve got the coding chops to work in this dynamic office? Then we want to meet you. If your school is not listed below, drop us a note, and tell us why you dream in C#.  Links to projects, coding samples, and other ways to showcase your craft are the best way to catch our eye (wink, wink).

Internships | Co-ops | Full-time.  We’re big on hands-on learning and career development. In years past we’ve had interns work on product demos, pick up a new programming language, and share their expertise on our blog. Your work will have a direct impact on the company and product. Interested? Stop by our booth to chat with one of our engineers!

Who we are:  A close-knit, dynamic, and agile team.  We work hard: Crafting artful code while solving challenging problems. We play hard: Office foosball, board games, cookouts, and company retreats. We’re encouraged to develop our skill sets by attending conferences and classes.

What we do: We aim to make business people more productive through all of our products. As a leading developer of Microsoft Office reporting software, we build scalable enterprise solutions.  Our products are OfficeWriter (an API for reading and writing Microsoft Office documents) and FileUp (a secure and easy-to-use File Transfer API).

Find out more about internship and career opportunities at SoftArtisans and how to join the SA Crew (and get in on those BBQs) by interacting with us on all of the usual social media hotspots or visiting one of the career fairs below.  Looking forward to seeing you then!

FALL CAREER FAIRS

Worcester Polytechnic Institute

Wednesday, September 18, 2013

12:30 – 4:30 pm

Rochester Institute of Technology

Wednesday, September 25, 2013

11 am – 4 pm

@RITCareerFairs

RPI

Friday, September 27, 2013

10 am – 3:30 pm

Olin College

Wednesday, October 9, 2013

11 am – 2 pm

Can’t make it? View open positions and apply online below!


Stories from the WIT Trenches: Emma Ideal

$
0
0

[Stories from the Women in Tech Trenches is a series of posts exploring the personal stories of real women in technology. Every woman in tech overcame, at the very least, statistical odds to be here; this blog series aims to find out why, and what they found along the way. This week we met up with Emma Ideal, an author, physicist, and inspirational woman in tech. If reading her story inspires you to share yours, please email me.]
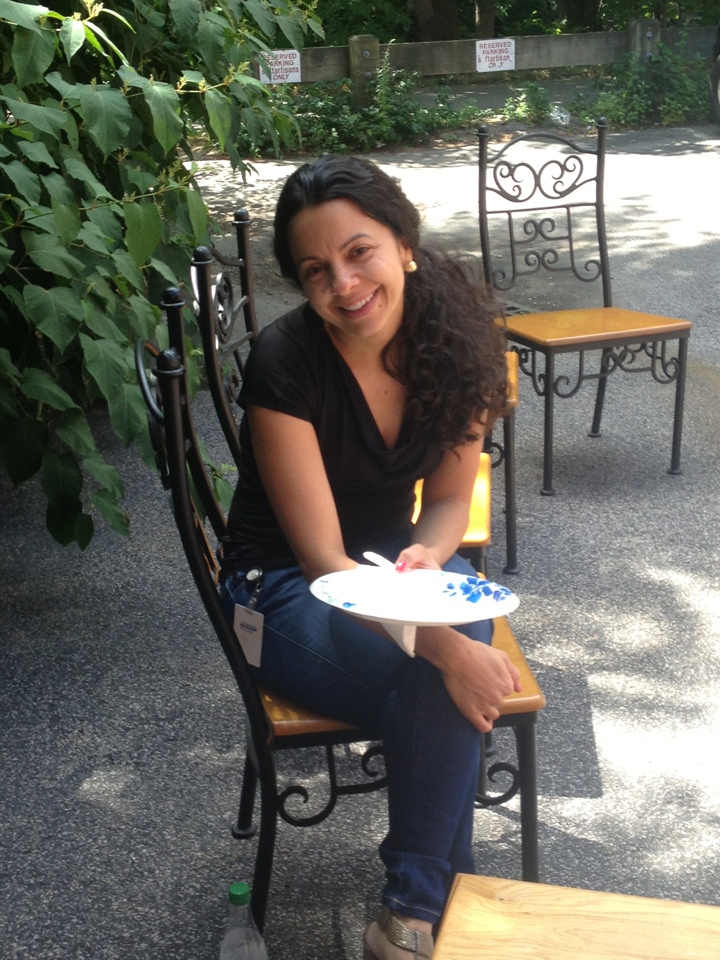
Photo Credit: Harold Shapiro

Photo by Harold Shapiro

Emma Ideal received a Bachelor’s degree in physics from UCLA in 2009 and is now in her fifth year of doctoral studies in physics at Yale University. She is working on a thesis in particle physics, performing a search for the elusive Standard Model Higgs Boson at CERN’s Large Hadron Collider located near Geneva, Switzerland.

Questions:

1.) You’re doing ground-breaking work in particle physics at CERN at the Hadron Collider, especially at an exciting time in physics as the Higgs Boson particle is gaining more worldwide recognition. Can you tell us a little about that?

As you say, I landed in graduate school at a very good time! The Higgs Boson is a fundamental particle that was theorized to exist in 1964, so it’s taken almost 50 years to find evidence of its existence. The Higgs is an unstable particle, meaning quickly after its production, it “decays into” other particles. Therefore, we discover the Higgs Boson not by observing the Higgs itself, but by observing these daughter particles. There are many different particles the Higgs can decay into, and my research focuses on particles called taus. These are essentially heavier versions of the familiar electron. The discovery of the Higgs Boson gives us insight into how the various fundamental particles have acquired mass (and are therefore not whizzing around our universe at the speed of light!).

2.) You just recently authored the book, Blazing the Trail: Essays by Leading Women in Science, a collection of essays of renowned female physicists, engineers, and chemists – can you tell us a little about that? How did the idea come about and what inspired you to do it?

In April 2011, I flew halfway around the world to South Africa as a U.S. delegate to the 4th International Conference on Women in Physics. There, I stumbled upon a workshop focused on methods for attracting girls to physics. A member of the Indian Academy of Sciences presented on his book Lilavati’s Daughters, a compilation of essays written by female Indian physicists. I was inspired to create an analogous book for an American audience, where essayists describe what brought them to the sciences, recount gender-related issues they’ve faced and have overcome, and give advice to the next generation on how to successfully launch a career in the sciences today. Readers will have a look into what a physicist’s life is really like, see that science is fundamentally about curiosity and asking (and finding answers to!) hard questions, and discover how attainable success is with the right attitude and work ethic. In addition, many young women can feel isolated in the career and gender challenges they face, and my hope is that from reading the essays within they see that, in fact, they are not alone!

We all know there is a gross under-representation of women in most sciences, and in particular physics. Blazing the Trail: Essays by Leading Women in Science was created to inspire a new generation of young women to consider careers in STEM, attacking this problem of under-representation at its root. It’s being sold for no-profit on Amazon!

3.) Whom do you look to as mentors and/or sources of inspiration?

The most long-term role model I’ve had is my older brother. I recall so vividly when he was in second grade and I was in kindergarten, and my mother would sit down with him to do math flash cards  (I would watch intently). I could not figure out for the life of me why I was so much slower than my brother at solving the problems! I was determined to catch up. My brother’s academic and career success has always pushed me to achieve my own.

My Ph.D. thesis advisor, Professor Sarah Demers, is also a huge source of inspiration to me. She successfully oversees four graduate and four undergraduate students, while raising two young children at home with a husband who is also an academic! We have had (many!) conversations on balancing career and domestic responsibilities, the challenges faced by dual-academic-career couples, and gender-specific setbacks she, her peers, and other women in science throughout history have experienced.

4.) Can you take us back to your “eureka!” moment—a particular instance or event that got you interested in STEM?

I was a third-year undergraduate in physics at UCLA, when I attended a colloquium on neutrino oscillation. I had heard of neutrinos before, but I knew little if anything about them. Neutrinos are fundamental particles, and quite the elusive type. Trillions of them are passing through your body as you read this, but you probably don’t feel them! They hardly interact with our universe, so “catching” a glimpse of one is quite difficult. To add to the oddity, there are three “flavors” of neutrinos—electron, muon, and tau—and as they whiz around the universe, they apparently change flavor. What I took from this colloquium: particle physics was for me. I’ve never turned back! Moreover, taking the particle physics course, I learned that there are six quarks: up, down, top, bottom, charm, and strange. I concluded that particle physicists must have a good sense of humor.

5.) Growing up, did you have any preconceived perceptions of the tech world and the kinds of people who lived in it?

Absolutely. The terms “nerd,” “bookworm,” and “introverted” come to mind. And well, I’m all of these things, and I’m proud to say so! People in tech, and STEM more broadly, are problem solvers. They take complex, difficult problems and think about ways to break them down to make them more manageable and solvable. This not only requires technical and mathematical competence but also critical thinking skills and an unbreakable persistence! I knew that a gender imbalance existed, and continues to exist, in STEM, but physics was too intriguing to let that scare me away…

6.) What led you to this career path? When did you first start working with tech? Was it by choice?

Growing up, I was an athlete. Softball, basketball, soccer, tetherball, dodgeball—you name it, I was on the field, court, or rink. Most of the time, I was playing and competing with boys. My belief was: “He can do it, I can do it too…and better.” I loved challenges, held high expectations of myself, and had a great love of learning. Physics was the most challenging subject I could think of! It helped also that my father, a high school math teacher, would give me math workbooks every summer that would prepare me for the academic year ahead; I adored these workbooks. I found comfort in the objectivity of science and mathematics, which stood in stark contrast to the subjective nature of the arts and humanities.

7.) Did you experience any personal or systemic setbacks at any point of your academic or professional career?

I have thus far been fortunate that the challenges I have faced have not been too overwhelming. Academically the hardest challenge I faced was Yale’s physics qualifying exam. Ph.D. candidates have to take a comprehensive exam in their second year, testing their broad knowledge of the field. Needless to say, it was difficult. I failed the first time but was given the opportunity to take it again the following year. That year, two close friends tragically passed away, and my grandfather succumbed to lung cancer. Getting through the emotional turmoil was only part of the struggle, and studying for the exam only stressed me out more. I started to experience air hunger, which caused me to frequently gasp for air, and I gained an unhealthy amount of weight because I was leading a sedentary lifestyle. However, I managed to knuckle down and pass the exam that year. I learned methods for dealing with stress and how to better manage my time. Now, being on the other side of this exam I believe that if I survived that, I can survive anything in graduate school.

8.) How do you balance the rigors of academic life, co-authoring a book, and finding time for outside activities?

I think different people work best in different ways. I have found that I am most efficient when I focus for a couple of hours on one activity, then the next couple of hours on another. I also change work environments; since my research requires only a computer, I can be productive from home or in an office. I have also practiced browsing at the web (Facebook, news, random Google searches…) only when preparing and eating a meal or in the evening time. I find that varying my activities actually helps me be more productive in my research. Often times when I’m stumped in my research, turning my attention to something less left-brain-taxing is a useful trick—I come back to my research a few hours later refreshed and with new ideas.

9.) Do you have any suggestions for how to get more girls interested in STEM? Is this important to you?

Science is truly about curiosity, and we are all born curious creatures. As young children we look around at our environment; ask “what,” “why,” and “how”; and use all the senses available to us to come to an understanding. So, if we all have similar beginnings, then why is there such a considerable gender asymmetry in STEM?

For many years we have propagated distinct gender roles for women and men. Men were typically the breadwinners, and women were more often housewives. Cultural inertia prevents us from rapidly balancing the scales. I think the home is the place where we can make the most progress toward building a society that expects both men and women to be equal contributors to STEM. We should foster an environment where both our sons and daughters are engaged in critical thinking, encouraged to perform academically, and supported in their studies of whichever topics they find interesting, regardless of whether it fits gender stereotypes. As a woman in STEM, I hope by showing my (future) daughters how much I enjoy what I do, they would consider a similar path for themselves!

10.) Do you have anything to add that you haven’t had a chance to mention?

To aspiring scientists: You will inevitably experience times that are challenging, that have you mentally banging your head against a wall, and that will likely have you asking the question, “Am I really smart enough to be a scientist?” The answer is yes. Don’t give up easily when it comes to something you love. Passion, hard work, and persistence are a winning combination.

Sparklines in OfficeWriter

$
0
0

[In OfficeWriter 8.6 we introduced support for sparklines in your Excel reports. Sparklines are mini graphs that live within a cell of your Excel spreadsheet to quickly visualize and identify trends in your data. Below is an example of how to use sparklines within OfficeWriter reports.]

Hi! My name is Kyle and I worked on developing support for sparklines in ExcelTemplate. For those unfamiliar, a sparkline is basically a small chart that lives in a single cell. Sparklines are a great way to quickly visualize trends in data, especially if they are located in cells near their data source.

sparklines_image1

Below we’ve put together a demo of using sparklines within OfficeWriter’s ExcelTemplate. The first step is to insert data markers and sparklines into the file. Here I’ve inserted a sparkline next to the row of data markers and created a group of sparklines immediately below the data markers. The data source for the sparkline in cell E1 is A1:D1. The data source for the sparkline in cell A2 is A1 and so on for the rest of the group.

The demo code is very simple. We create fake data, open the template file, bind the data, and process the template.

using SoftArtisans.OfficeWriter.ExcelWriter;

namespace XLTSparklinesDemo

{

class DemoSparklines

{

static void Main(string[] args)

{

// The path names currently point to the C drive. Change these

// to match the directory in which the Excel files are saved.

const string inputFile =

@”C:\XLTSparklinesDemo\XltSparklinesDemo.in.xlsx”;

const string outputFile =

@”C:\XLTSparklinesDemo\XltSparklinesDemo.out.xlsx”;

object[][] data = CreateData();

string[] dataNames = CreateDataNames();

ExcelTemplate xlt = new ExcelTemplate();

xlt.Open(inputFile);

xlt.BindData(data, dataNames, “KylesSource”, xlt.CreateDataBindingProperties());

xlt.Process();

xlt.Save(outputFile);

}

static object[][] CreateData()

{

object[] testData1 = {1, 2, 3, 4};

object[] testData2 = {4, 3, 2, 1};

object[] testData3 = {1, 3, 3, 1};

object[] testData4 = {3, 1, 1, 3};

object[][] testData = {testData1, testData2, testData3, testData4};

return testData;

}

static string[] CreateDataNames()

{

string[] names = {“columnOne”, “columnTwo”, “columnThree”, “columnFour”};

return names;

}

}

}

ExcelTemplate will generate a sparkline for each row of data that was inserted. The sparkline group below the data markers is moved down to accommodate the insertions. Additionally, the data range for the sparkline in A5 is now A1:A4 and so on for the rest of the group.

sparklines_image2

You can download a copy of this demo here. This feature was implemented in OfficeWriter version 8.6, and you’ll need an OfficeWriter license. You can download an evaluation version here if you don’t already have OfficeWriter installed.


// ]]>

Choosing OfficeWriter Designer or Designer .NET

$
0
0

Overview

OfficeWriter Designer is an add-on for Microsoft Excel and Microsoft Word that allows users to create new RDL reports and design pre-existing reports inside of Excel or Word. Until OfficeWriter 8.6, the original OfficeWriter Designer was the only tool available with this functionality.

However, as of OfficeWriter 8.6, SoftArtisans will include a second, new version of OfficeWriter Designer called the OfficeWriter Designer .NET. The OfficeWriter Designer .NET is a completely rewritten version of its predecessor, created from .NET/C# using VSTO (Visual Studio Tools for Office run time).

Benefits of OfficeWriter Designer .NET

  • Office 64-bit support
  • No dependencies on COM/VBA
  • More robust handling of modifications to queries in Visual Studio/Report Builder
  • Better parameter support with the View functionality, including support for cascading parameters

Which Designer Should I Use?

The new OfficeWriter Designer .NET does not currently support all of the features of the previous Designer. For full functionality support, use the original OfficeWriter Designer. Please see the feedback section below for more information about submitting requests for new features.

The following OfficeWriter Designer features are not yet available in the Designer .NET:

  • Support for SSRS 2005 or earlier
  • Support for RDL’s made from the Designer MS Query integration (i.e. RDLs are created in Excel/Word)
  • Support for Microsoft Word
  • The ability to edit or add new OfficeWriter Reporting Services formulas. Designer .NET preserves SSRS formulas created in the old Designer, but does not provide a way to create or edit the formulas.

Note for SharePoint users: If you are using SSRS in SharePoint integrated mode, the OfficeWriter Designer .NET cannot directly retrieve/publish/view reports that are stored in SharePoint report libraries, so files will need to be downloaded/uploaded from/to SharePoint directly. Reports will need to be exported directly from SharePoint.

Both the OfficeWriter Designer .NET and the original OfficeWriter Designer are available for download from our product updates page or through our free evaluation.


Feedback

SoftArtisans is looking for feedback about which features you would like to see! If you have a support contract with us, contact us here . If your company does not have support, submit a feature request. If you are interested in purchasing a support contract, please check out our options.


// ]]>

Viewing all 140 articles
Browse latest View live